Value Axis Line
Value Axis Line: This video contains how to use Value Axis Line of Chart in AIV.
In Formatting Property click on Value Axis Property.
The toggle button is enabled by default that’s why it shows disabled Axis Line in below Figure.
Enter following details in Value Line:
- Border Width: 5
- Border Color: #eb0a0a
- Border Opacity: 0.6
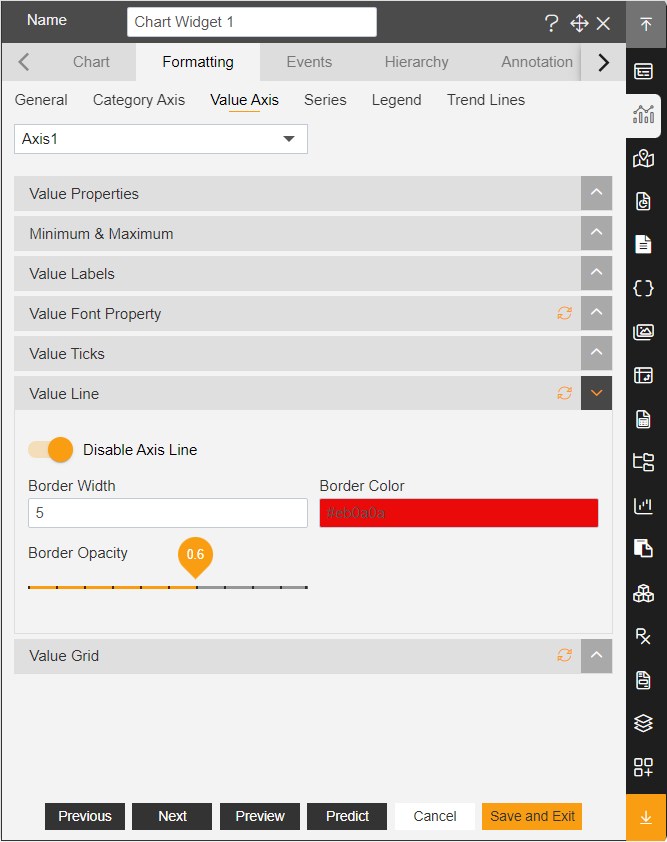
The Border width is used to set the width of line.
Border opacity is used to set the visibility of the value axis line in chart.
Border Color is used to control the color of the value axis line, from color, user can also control the opacity and choose color from color code.
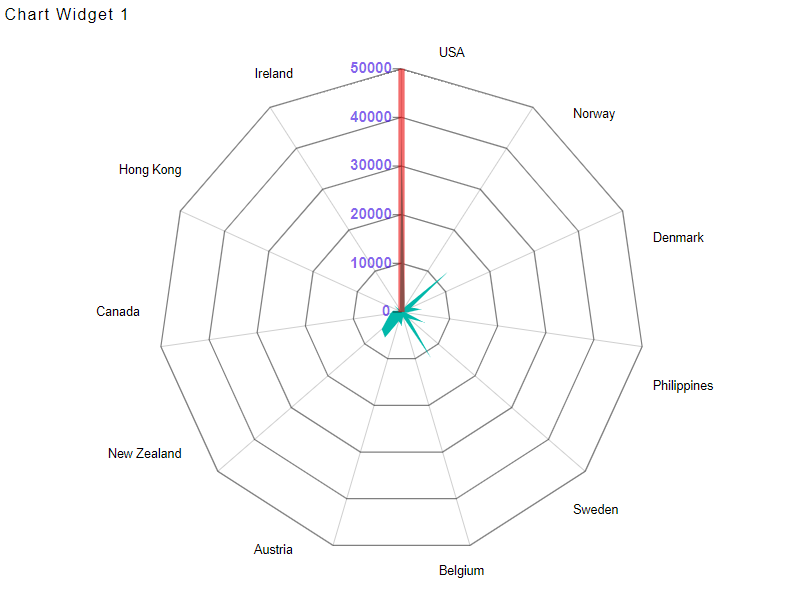
Click on Preview and Save and Exit.
Now, match your Radar chart with the below example, it should look like the figure below:
✒️ To know more about other Value Axis property click on below links:-